GlacierGrid new Issues feature in UI 2.0 introduces a more intelligent, structured, and scalable way to manage issues across your account. Rather than receiving excessive, redundant individual alerts, Issues achieves a 1:1 relationship between real-world problems and what is shown in the GlacierGrid web app.
This guide walks you through:
- What Issues are and how they work.
- How to navigate the Issues screen.
- How to interpret and respond to active or resolved Issues.
- Tips for filtering and monitoring.
What is an Issue?
An Issue is a real-world problem detected by GlacierGrid when your equipment goes out of its normal operating range for a set period of time. When these conditions are met, a Food Safety, Comfort, Connectivity, Energy, Mechanical Issue is created and displayed on your Active Issues screen. Alerts will also be sent for any Issues that have nested alerts configured. This structure gives you a clearer view of what’s happening at your sites, helping you avoid alert fatigue and manage assets in a more streamlined manner.
Issue Types:
- Food Safety Issues – temp/humidity problems impacting coolers/freezers that could risk food safety/quality.
- Comfort Issues – temp problems impacting HVAC equipment that could jeopardize guest/employee comfort.
- If you do not have HVAC equipment this table will show up as blank on your home screen.
- Connectivity Issues – instances of devices going offline, disrupting monitoring/control.
- Energy Issues – Energy usage (kW) outside of configured thresholds, helping you track anomalies tied to real energy consumption.
- Mechanical Issues – HVAC performance issues detected through poor supply air temperature (SAT) behavior.
Issue Structure:
All Alert Configs are nested within a parent Issue Config:
- When the Issue Config conditions are met, an Active Issue will be created and displayed in the Active Issues table.
- When the Alert Config conditions are met for any nested Alerts, notifications will be sent to the relevant recipients.
- If an Issue Config conditions are no longer met for any nested Alerts, notifications will stop sending to the recipients for that instance of the issue.
Issues Summary on the Home screen
On the home screen, you'll find a high-level summary of issues categorized into three tables (Issue Type):
- Comfort Issues
- Food Safety Issues
- Connectivity Issues
- Energy Issues
- Mechanical Issues
Each issue Type includes:
- Location of the issue
- Number of Issues
- Duration (how long the issue has been active)
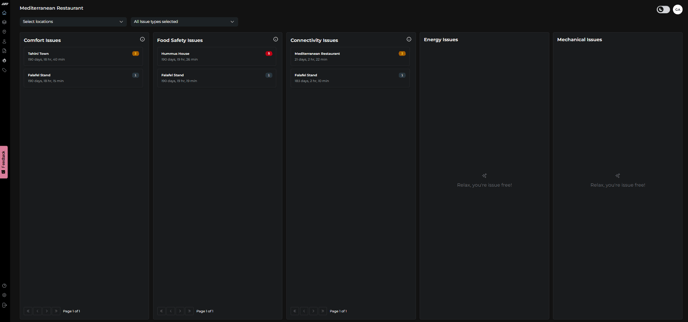
- If a location has no current issues in a category, you'll see the following message: “Relax, you're issue free!”
Note 1: By default, sites are sorted first by the number of active issues and then by issue duration. This ensures users can quickly identify and prioritize the most urgent sites requiring attention.
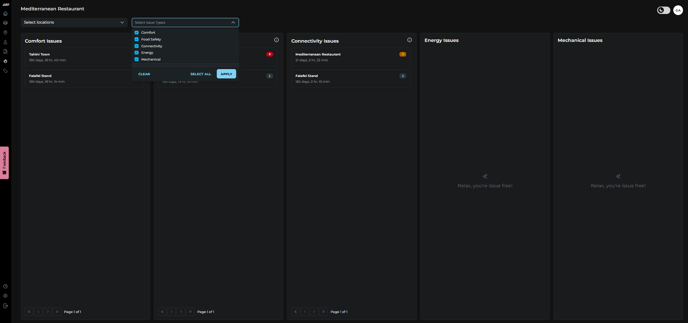
Note 2: You can filter issues by location or by issue type using the dropdown menus above the tables. This allows you to quickly narrow down the list and focus on specific sites or categories. If your account doesn’t include certain issue types (e.g. Mechanical, Energy, or Comfort), the corresponding tables will appear empty. This is expected behavior. You can use the issue type filters to hide these categories and keep your dashboard clean and easier to navigate.
- Clicking on a location will open a table with additional issue details
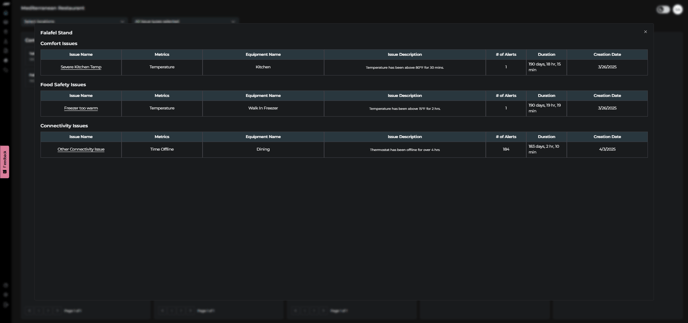
- If you click on the issue name, you’ll be redirected to the full Issues screen, where you can view complete information, including graphs, past alerts, and more context.
Each active Issue includes the following information:
- Issue Name (e.g. freezer too warm)
- Issue Type (Comfort, Food Safety, Connectivity, Energy, and Mechanical)
- Metric (eg. Temperature, Time Offline)
- Equipment Name
- Location Name
- Number of Alerts Triggered
- Issue Duration
- Open Date
- A graph of sensor behavior (in case of temperature issue)
- The Past Alert Log screen below the graph.
- Status (Active or Resolved)
- Close conditions to prevent premature resolution

Detailed View: Issue Screen
Navigate to the left-hand sidebar and click on the Flame Icon to open the Issues screen. You'll find three tabs at the top:
- Active Issues – Real-time view of currently open issues.
- Issues Configs – Create or Edit issues and rules for alerting.
- Active Alerts – Summary of active alerts across your account.

Active Issue Table
Understanding Each Column in the Table:
- Issue Name: Description of the problem (e.g., Freezer too warm, Hub Connectivity Issue)
- Issue Type: Category – Food Safety, Comfort, Connectivity, Energy, or Mechanical.
- Metric: What’s being measured (e.g., Temperature, Time Offline)
- Equipment: The device or area affected
- Location: Specific site/store where the issue was detected
- Issue Duration: How long the issue has been active
- Open Date: When the issue was first created
Note: You can sort, filter, or search by any of these fields to refine table results and find exactly what you need.
To view detailed information about an issue, click on its corresponding row in the Active Issues table.
Issue Configs Table
Using this tab, you can view a complete list of issues (both active and disabled) created for your equipment. From here, you can also create new issues and alerts, or edit existing ones.

Active Alerts Table
In this tab, you can view a summary of all currently active alerts across your entire account, helping you quickly identify and address any ongoing issues.

Additional features within Issues:
- Bulk Actions – users can create Issue Configs at the Location and/or Equipment level to easily setup standardized Issue/Alert Configs across their account
- Connectivity Issues by Device – users can select the offline durations for different Device Types, providing more configurability for Connectivity Issues/Alerts
- Close Conditions – users can now specify how long conditions must return to normal before we can resolve an Issue, preventing premature closure
-
Issues Log report—available in the Report Builder—provides users with a comprehensive export of both active and historical issues across selected locations. Each issue is represented as a single record, including key details such as the triggering metrics, affected equipment, the number of alerts sent, open and close timestamps, duration, and current issue status. This gives teams a clear, consolidated view to track issue patterns and manage resolution effectively.
Looking to set up new alerts or issues; check out this article.