


Here are some tips for using our dashboard to help you take advantage of all the GlacierGrid has to offer.
This article will explore how to get the most from GlacierGrid’s dashboard:
- Find and analyze data
- Create alerts
- Invite users and assign them to Teams
- Create and schedule reports
The GlacierGrid dashboard is accessed from your browser, either on your computer or mobile phone. You can also read data and view alerts on our mobile app.
The dashboard tab
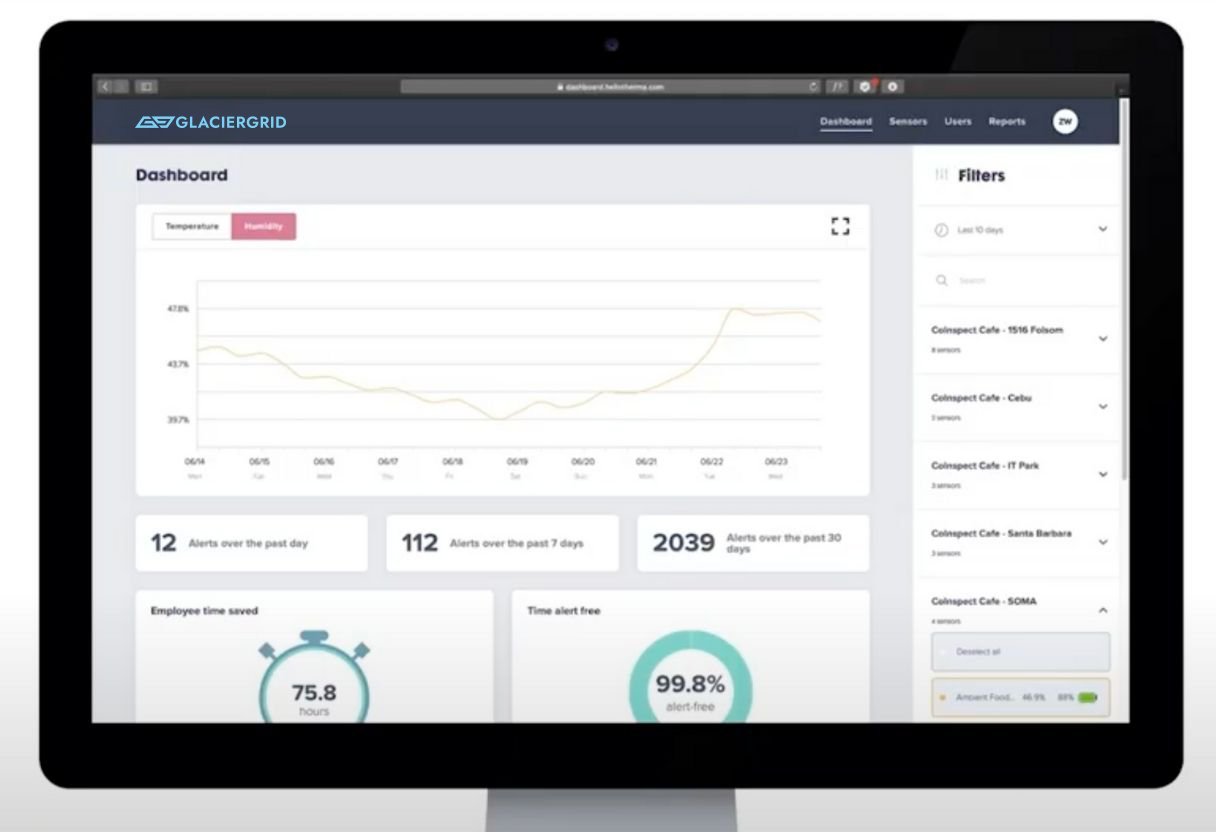
When you log in to the GlacierGrid dashboard, the first page you will encounter is the “dashboard” page. This page allows you to view data such as Temperature, Humidity, Alerts, and Employee Time Saved.
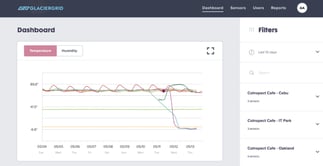
The first visualization on the dashboard page is the temperature graph, and each colored line represents a separate sensor. By default, the temperature graph shows data over the last ten days. To change the time range, select the down arrow next to the time filter and select the time window you're looking for.
How to use the dashboard:
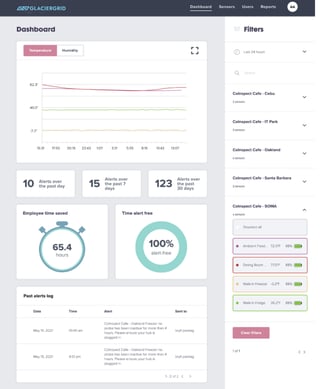
- Use the temperature graph to identify spikes and shifts in temperature and humidity quickly.
- Placing the mouse over the different sensors listed on this page.
- Compare data between different locations or focus on one location by finding the location view to the right of the graph. Open the locations and select the individual sensors you wish you view.
- Select a particular sensor if you are looking for one piece of equipment
- Select ‘select all’ to view all of the sensors within one location.
Analyzing dashboard data:
After you’ve selected a location or sensor, the graph populates with the data you have selected. Measuring data over short periods, such as in minutes or hours, allows you to understand current trends, such as the door of a low-boy being left open. Viewing trends over extended periods can help (such as 10 or 30 days) indicate the need for maintenance.
For example:
Aslow, slight warming trend could be a sign of a broken compressor. Below the temperature graph, you will find alert metrics over the past day, week, and month, allowing you to keep track at a glance. The “Employee Time Saved” and “Time Alert Free” features will enable you to quantify how GlacierGrid has helped streamline your operations.The bottom section of the “Dashboard” tab is a record of all alerts logged by each of your locations and sensors. Additionally, the log also shows the alerts’ recipients to increase accountability.
The sensors tab
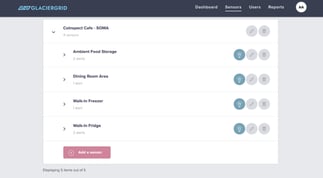
The Sensors tab allows you to create locations, add sensors, and set alerts.To set up a location, click “Add a Location,” then add its name, address, and store number. Once you have created a location, then add the sensors to the locations.
To add a sensor to a location:
- Click on the location you wish to add a sensor to.
- Click on the button that says “Add a sensor.”
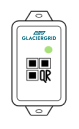
- Then, add the sensor’s ID number. Find the number on the front of the sensor underneath the QR code and to the right of the initials that say “SN.”
- After inputting the ID, name your sensor. For example, if the sensor is placed in the walk-in, call it “walk-in” for easy identification.
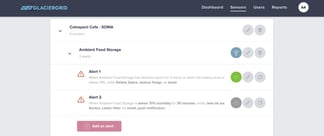
To set an alert:
- After installing GlacierGrid sensors into your equipment, we recommend letting the sensor system collect an accurate read of your temperature data for 1-3 days before setting alerts. Review the real-time temperature data from your device, make any preliminary adjustments necessary to your equipment settings, and set alerts based on how your equipment performs.
- To add an alert, select a location and a sensor.
- Find and click on the “Add an Alert” button.
When you click on the button, it will open up a variety of parameters to customize:
- Choose to monitor temperature or humidity.
- Set a parameter threshold.
- Choose whether you want to be notified of conditions above or below that threshold.
- Use the dropdown “For” menu to select the time interval.
- Click “Then, Notify” to choose who will receive the alerts.
- Choose which method you would like to receive the alert by (SMS, phone call, or push notification)
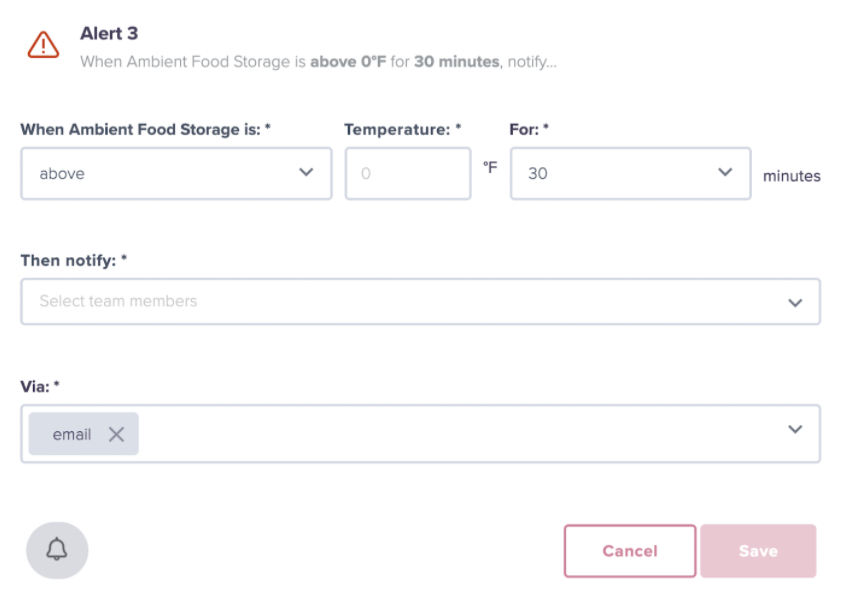
If you would like to receive push notifications from GlacierGrid, make sure to allow them in the settings section of your mobile device.
Once you have alerts set:
- Edit alerts by clicking on the “Pencil” icon.
- Duplicate alerts by clicking on the “Stacked Pages” icon.
- Turn on Smart Alerts!
How to turn on smart alerts
Smart Alerts are built for teams looking to minimize the number of alerts they receive from GlacierGrid. Smart Alerts intelligently adjust your alert temperature thresholds to help prevent excessive notifications. When enabled, Smart Alerts automatically increase or decrease your temperature threshold one degree at a time (with a maximum of 5 degrees).
Once the 5-degree threshold is reached, GlacierGrid proactively recommends adjusting the temperature of your equipment by a few degrees or making a preventative maintenance service call. To enable Smart Alerts, select the brain icon to the right of the sensor name on the Sensors page. The icon will be blue when Smart Alerts are enabled.
The users tab
The “Users Tab” is where you edit your personal contact information, such as your name, email address, and phone number. This is also where you add admins and users to the dashboard and delegate them into teams. User profiles are separated into two groups:
- Admins can make adjustments, such as setting alerts or creating reports.
- Users can view data and alerts but can not make adjustments to settings.
To add a team member to the dashboard:
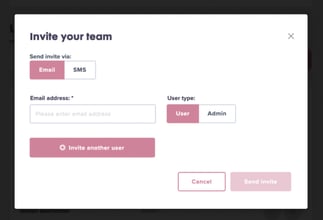
- First, click the button that says “Invite Users.”Once you’ve selected this:
- Choose to invite them by email or SMS
- Or invite them as an Admin or as a User
Then enter in either their phone number or email address
- Click “Send Invite”
- To invite another member of your team, press “Invite Another User” and repeat the process.
- Once you have invited a user and they have registered, you can edit or delete their profile by clicking the pencil icon to the right of their name.
How to create teams
The GlacierGrid dashboard can now create teams. The “Teams” feature should be used for location-specific teams that only need access to particular location data. This makes it easy for team-specific users to find the data they need.
To create and edit teams:
- Toggle the dashboard screen to “Teams” and click “Add a Team.”
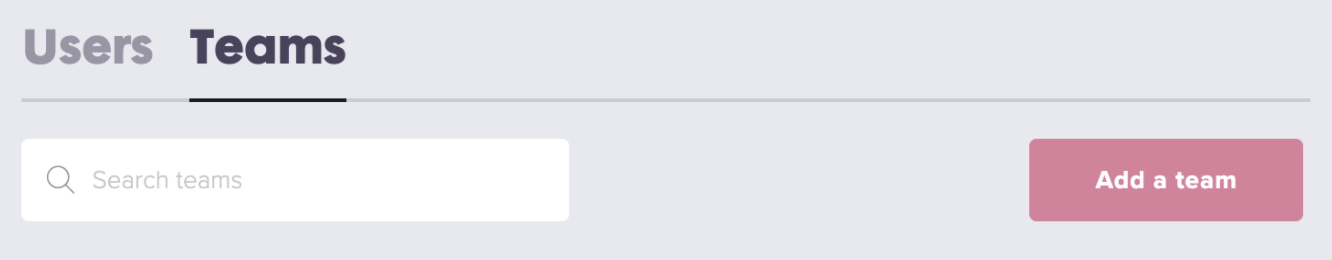
- Name the team
- Select which location the team will be needing data for
- Then select which users will be on the team
Note: If you add a user to a team, they will only see the locations you have selected.
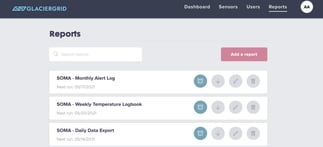
The reports tab
Use the reports tab to create custom or recurring reports for internal visibility, compliance, or facilities maintenance. Use this feature to analyze and identify trends, such as warming events and temperature spikes, leading to potential inventory loss. Remember, different environments require different temperatures and management – it’s normal for some sensors to have cyclical spikes, as long as they don’t overpass the temperature threshold.
In closing
Now you’ve learned how to use your GlacierGrid Dashboard!:
- Find and analyze data
- Create alerts
- Invite users and assign them to Teams
- Create and schedule reports
To learn more about other GlacierGrid features, please visit our YouTube page. Still, need help? Please email us at support@glaciergrid.com.