


Configure Your IoT Monitoring Dashboard to Help You Lead Better
Dashboards are critical to the processes of restaurant operations. Like the dashboard in your vehicle, IoT dashboards convert large amounts of data into a meaningful visualization, providing performance indicators that help you make better decisions. For example, dashboards allow you to send logs to third-party inspectors and automate reporting.
As technology improvements allow equipment that has traditionally required manual observation to become connected to the internet, the way we use the data this equipment produces changes quickly. Connecting temperature monitoring devices to the internet of things (IoT) has created the ability for restaurants to monitor temperature-sensitive areas remotely. These remote temperature monitoring devices are powerful tools for the foodservice industry, helping managers enforce safe temperature thresholds.
IoT monitoring networks allow you to receive real-time data, such as temperature notifications, to help make informed decisions. IoT technology whitepapers are released weekly displaying the multiple ways remote monitoring is the future. Real-time metrics that lead to restaurants avoiding spoilage or waste can have a meaningful impact on cost savings and profitability.
IoT temperature monitoring also requires well-organized dashboards to ensure accurate time and temperature controls. Read on to learn a few ways IoT monitoring dashboards can make operations more efficient.
Why Do I Need a Dashboard?
Good dashboards highlight key metrics that are pertinent to the functions of the restaurant ecosystem. The value of a great dashboard is the ability to provide a clear view of your organization. Effective temperature monitoring dashboards include:
- Various reporting tools such as data export, temperature or humidity logbooks, alert logs, and audit logs
- Charts and tables that show real-time temperatures inside of your cooling system.
- Alert management tools that allow you to stop and start monitoring during office hours and downtime
- Filtered views, making it easier to see specific areas within multiple locations
The purpose of using IoT devices to monitor temperature is so operators can take actionable steps to protect their inventory during service hours and downtime. For best results, the organization should develop a robust food safety protocol that consistently monitors critical control points to ensure that perishable items remain edible and has capabilities for machine learning.
IoT solutions help operators keep perishable food at an edible state by ensuring the efficacy of both your inventory and cold storage equipment. When conditions in either are out threshold, your dashboard should ideally alert you to take steps to prevent a loss event your equipment breakdown. A simple, clear dashboard is paramount since restaurant operators need to use it without worrying about the technical know-how.
Leaders Focus on Reports that Inform Decision Making
To keep up with the pace of the operations, configuring as many processes as possible and using specialized tools is a must. Compiling reports manually is a complex procedure, and the result frequently isn’t worth the titanic effort. Dashboards should be tailored to each level of the management use-case within the organization. Dashboards create more initiatives for network performance at all levels. Different levels of management need to interact with automatic data for different decision-making reasons.
Lower levels of management use data for operational information. Operational information relates to the organization's day-to-day operations and, thus, is helpful in exercising control over the repetitive processes. Typically, general managers ensure that equipment is up to compliance standards, including inventory and loss event control. Logging manual reports can become tricky at this level and increase human error.
Middle-level managers use data for tactical information. Tactical information helps managers allocate cost-effective resources, price controls, maximize profits and establish controls to implement the top-level plans of the organization. Mid-level managers may receive tons of notifications from both levels of management providers above and below, which may become overwhelming. Automate reports allow managers to assess information, making communicating with multiple levels easier.
Meanwhile, executive-level managers utilize data for strategic information. Strategic information helps identify and evaluate these options so that a manager makes informed choices that are different from the competitors and the limitations of what the rivals are doing or planning to do. Dashboards and IoT monitoring create a technological advantage so teams can predict and reduce equipment breakdowns to streamline operations.
All the while, predictive data-keeping is essential for a business to stay afloat. Leaders often use reports to make decisions about the future and find patterns in the past that can improve performance.
Remote access tracking and creating reports may seem complicated, but it’s critical to a business, making tracking inventory, maintenance, and other lower costs easier.
Avoid Information Overload
On the one hand, dashboards are vital in decision-making; on the other hand, dashboards can fail. Dashboards fail for many reasons; the most common reasons are dashboard design mistakes. A good dashboard simplifies metrics for predictive maintenance. You’ll want to invest in an IoT solution dashboard explicitly designed for the foodservice industry for restaurant business processes. Here are a few of the most common dashboard mistakes:
- Building a one-size-fits-all dashboard
- Avoid using a dashboard with too many metrics. Single dashboards with few filters and smaller portions are easier to analyze.
- These dashboards typically show a lot of information to individual users that may be utterly irrelevant to their job.
- Poor layout choices:
- The information most often checked by users goes in the upper left-hand corner.
- Related metrics should be grouped.
- Metrics that need to be compared should be next to each other
- Using the wrong chart types
- Not all graphs and charts work on the dashboard
- A line chart is a great choice to display patterns of change across a continuum.
- Bar chart does a better job of displaying the same data in about the same or less space.
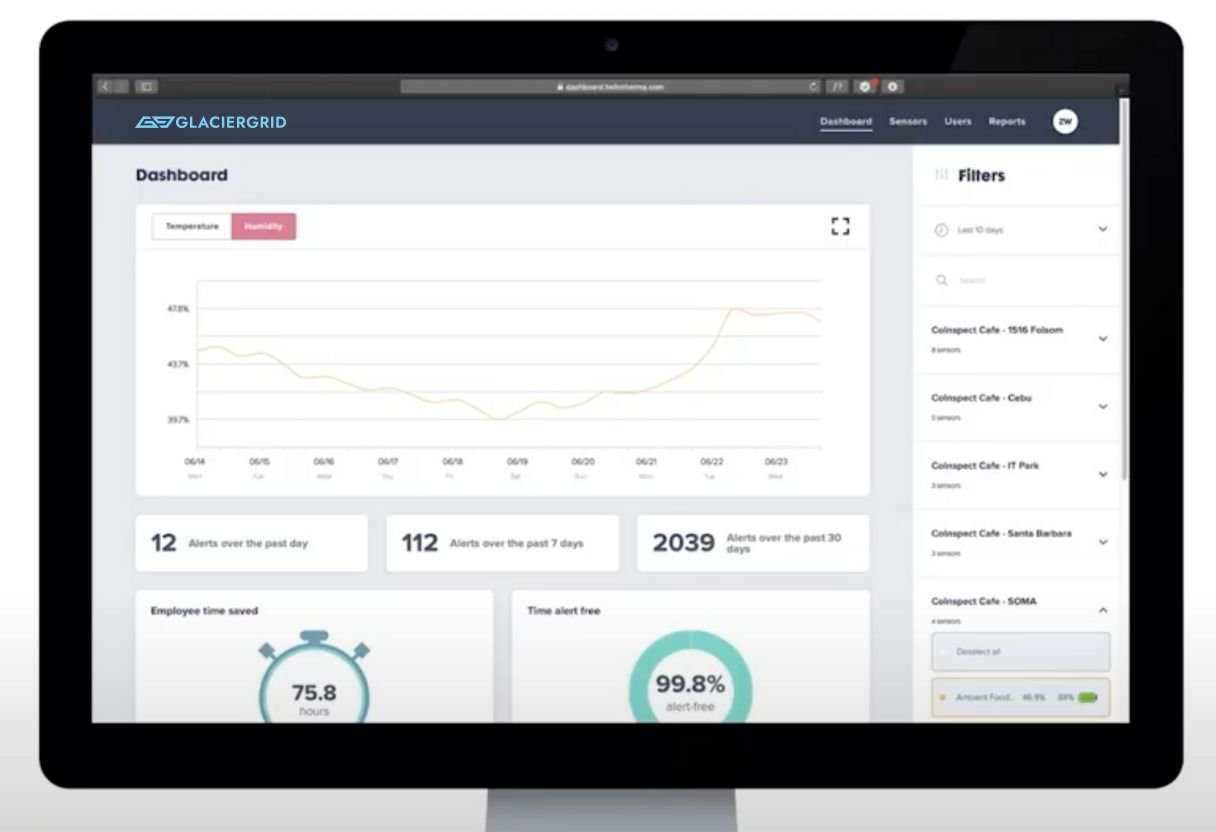
GlacierGrid, an IoT device for monitoring temperature and humidity, has a self-explanatory dashboard. On the home screen, some graphs show either temperature or humidity in your cold storage space to prevent loss events of inventory. All levels of operation can utilize the GlacierGrid dashboard.
Because the GlacierGrid dashboard is a cloud service, alerts can be received across multiple platforms and connected devices, including Apple, Microsoft, and even most cell phones. By providing continuous remote access to your sensor data restaurants can take cost-effective preventative actions to avoid downtime of difficult, and costly to repair industrial equipment.
Learn more about GlacierGrid’s dashboard
HAI hospitality uses GlacierGrid to automate their operating system and save time by allowing team members to view temperature data and alert history by date, location, or equipment.
All levels of management can use GlacierGrid dashboard. GlacierGrid protects your inventory from equipment failures, power outages, and human error. Receive alerts when an issue arises and utilize GlacierGrid data to eliminate costly last-minute repairs and manual temperature logs.
Want to see how GlacierGrid can help help your business succeed?