


GlacierGrid’s temperature monitoring and analytics platform is proven to reduce food waste, prevent equipment breakdowns, and reduce labor time in foodservice operations. While using GlacierGrid accomplishes these goals, it’s essential to know what trends in your data to look for. Check out our list for the five most important insights you can draw from your sensor data.
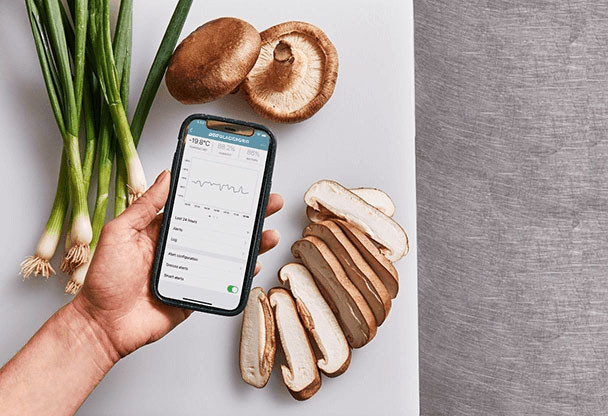
How to access your sensor data
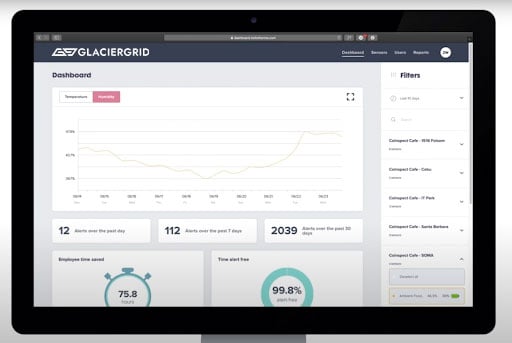
To begin, navigate to the dashboard tab to start evaluating your data. The first visualization on the dashboard page is the temperature graph. Each colored line represents a separate location. The temperature graph allows you to identify spikes and shifts in temperature quickly.
In general, measuring data over short periods, such as in minutes or hours, allows you to understand real-time events, such as the door of a low-boy being left open. Viewing progressions over extended periods can help indicate the need for equipment maintenance.
Gradual warming events
In the visual below, you will notice a gradual, upward trend in temperature for this unit since deployment, with the average temperature increasing by nearly 5℉.
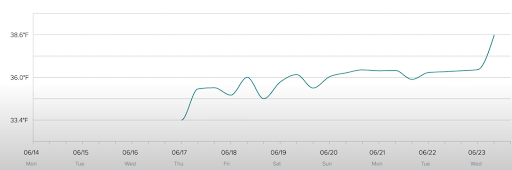
In this situation, we recommend turning down the temperature of this unit to see if this resolves the increase in temperature. A slight increase in temperature over some time may be an early indicator that this unit will require maintenance shortly.
Temperature excursions
Based on this data set, we can see a substantial spike in temperature for this unit since deployment. This has increased the average temperature by nearly 10℉. This has also caused a recent increase in alerts triggered for this sensor.
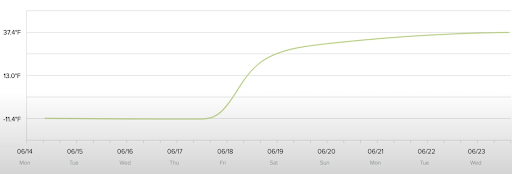
As in the previous example, we recommend turning down the thermostat of this unit to see if this resolves the increase in temperature.
Temperature fluctuations
In the diagram below, you can see multiple substantial variations in temperature for this unit since deployment, sometimes resulting in up to a 40-degree fluctuation in temperature. Suppose this is not the result of projected or scheduled usage for this unit.
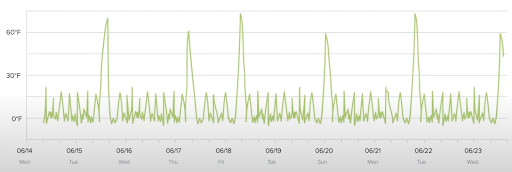
In that case, we recommend examining how this equipment is being handled and stocked to extend the lifespan, lessen overall power consumption, and reduce the number of GlacierGrid alerts triggered for this unit.
Sensor inactivity
Based on the temperature data available here, we can observe that this sensor is reading at room temperature over a prolonged period.
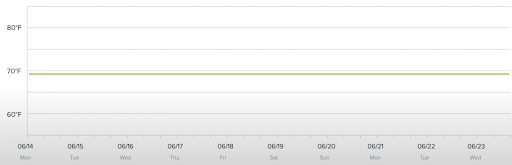
It may be possible this sensor is currently not in use or has been removed from this unit.
Temperature spikes
In the graph below, notice the 40°F elevation in temperature that occurred over hours. This circumstance is known as a temperature spike, and it can be very damaging to the inventory in the area where this sensor is located.
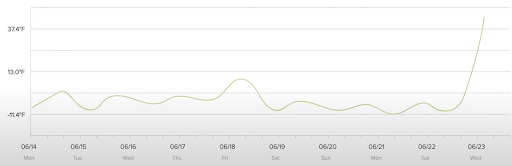
Temperature spikes of this magnitude can indicate serious mechanical issues that could mean the end of your equipment’s lifespan if unattended. In this circumstance, we recommend relocating the inventory found in this space and calling out an emergency maintenance team to inspect your equipment.
Learn more about how to get the most out of your dashboard by exploring our Help Center.